Featured post

Top 5 books to refer for a VHDL beginner

VHDL (VHSIC-HDL, Very High-Speed Integrated Circuit Hardware Description Language) is a hardware description language used in electronic des...

Showing posts with label Verification. Show all posts

Sunday, 26 March 2017

Understanding real, realtime and shortreal variables of SystemVerilog

This post will help you to understand the difference between real, realtime and shortreal data types of SystemVerilog and its usage.

We faced some issue with real and realtime variable while writing a timing check.
Below is a simplified example of that check. 

`timescale 1ns/1fs;
module test; 
  real a,b;  
  realtime t1, t2;

initial 
begin 
  #1ns;
  t1 = $realtime;
  #1.8ns;
  t2 = $realtime;
  b = 1.8;
  a = t2 - t1; 

  if(a == b)
    $display("PASS a = %f b = %f", a,b);
  else
    $display("FAIL a = %f b = %f", a,b);

end 
endmodule 

and here is what we got the display

FAIL a = 1.800000 b = 1.800000  

How that happened !!! is really 1.800000 != 1.800000  !!!!

Now let's try something else, instead of using real we use shortreal

`timescale 1ns/1fs;
module test; 
  shortreal a,b;  
  realtime t1, t2;

initial 
begin 
  #1ns;
  t1 = $realtime;
  #1.8ns;
  t2 = $realtime;
  b = 1.8;
  a = t2 - t1; 

  if(a == b)
    $display("PASS a = %f b = %f", a,b);
  else
    $display("FAIL a = %f b = %f", a,b);

end 
endmodule 

Now the result was as expected !!

PASS a = 1.800000 b = 1.800000

To understand this lets go to SystemVerilog LRM. As per LRM 

The real data type is from Verilog-2001, and is the same as a C double
The shortreal data type is a SystemVerilog data type, and is the same as a C float.

So float is 32 bit data type and double is 64 bit data type. This sounds cool but still how 1.800000 != 1.800000

No ! it's not only about being 32 or 64 bit data type its more about precision."Precision is the main difference where float is a single precision (32 bit) floating point data type, double is a double precision (64 bit) floating point data type ".

To understand this difference let's go beyond and print the values with more number of digits after decimal point.

In below example we have used both real and shortreal to see the difference.

`timescale 1ns/1fs;
module test; 
  real a,b;
  shortreal c,d;
  realtime t1, t2, t3, t4;

initial 
  begin 
    #1ns;
    t1 = $realtime;
    #1.8ns;
    t2 = $realtime;
    b = 1.8;
    a = t2-t1;

    if(a == b)
      $display("Case1: PASS \na = %1.100f \nb = %1.100f", a,b);
    else
      $display("Case1: FAIL \na = %1.100f \nb = %1.100f", a,b);
  end 


initial 
  begin 
    #1ns;
    t3 = $realtime;
    #1.8ns;
    t4 = $realtime;
    d = 1.8;

    c = t2-t1;

    if(c == d)
      $display("Case2: PASS \nc = %1.100f \nd = %1.100f", c,d);
    else
      $display("Case2: FAIL \nc = %1.100f \nd = %1.100f", c,d);
  end 

endmodule

Here is what the display is

Case1: FAIL 
a = 1.7999999999999998223643160599749535322189331054687500000000000000000000000000000000000000000000000000 
b = 1.8000000000000000444089209850062616169452667236328125000000000000000000000000000000000000000000000000

Case2: PASS 
c = 1.7999999523162841796875000000000000000000000000000000000000000000000000000000000000000000000000000000 
d = 1.7999999523162841796875000000000000000000000000000000000000000000000000000000000000000000000000000000

It's clearly seen that the 64 bit real variable has more precision that that or 32 bit shortreal variable.  

Here one more thing to consider is that we are taking difference of time. Floating point math is not exact. Simple values like 0.1 cannot be precisely represented using binary floating point numbers, and the limited precision of floating point numbers means that slight changes in the order of operations or the precision of intermediates can change the result. That means that comparing two floats to see if they are equal is usually not what you want.

The things will not matter much if you are doing calculations in nanoseconds so we suggest to use shortreal instead of real.
  

Monday, 21 November 2016

Advantages of Python over Perl

In the new competitive generation of chip designing where Time-to-Market is so critical and also the complexity of designs is increasing exponentially.  Adding to that it is also observed that the Verification is always considered the longest pole and takes nearly 70% of the chip design life cycle. Hence any opportunity to automate a  task that is repeatable more than once is considered of most importance to improve the verification productivity. This is where  “scripting” skills are highly valuable for any  Verification engineer.

After many years of writing design and verification automation scripts in Perl and Python, we would like to throw some light on the advantages of using Python.

Maintainability

As we all know, Perl is easy to write but hard to read, especially when someone else has written it. There are multiple ways of writing the same code. Add to this fact that many engineers take pride in writing highly obfuscated Perl that is a pain for others to read.

Maintainability is a critical aspect of any engineering project. Throwing away code and rewriting it is a productivity loss. Unfortunately, this happens a lot with Perl.

Python, on the other hand, has a clean syntax and typically there is only one way of doing what you want. Python code is hence much more readable. Even people who have never written Python code ever can understand it, as the syntax is very “pseudo-code” like. It is also easier to functionalize and modularize code in Python as the language naturally encourages this.

Re-usability

Perl is designed for use and throw. You write something in Perl, run it and then forget about it. It is very difficult to extend the functionality of a Perl script. Typically you would not have organized your code into functions, as Perl syntax does not encourage that. When you try adding some functionality to your Perl script you realize that re-writing it completely is better than re-using the earlier script and extending it.

Python syntax encourages re-usability. The mindset is different. When you write code in Python, you write with future re-usability in mind. This is really tough to do in Perl. Perl encourages shortcuts.

Scale

Writing large pieces of code (more than 50k lines) in Perl exposes the weaknesses in the language. Maintainability, performance, and packaging are big issues. Can I package my application in a way that doesn’t require users to download and install modules used by the application?

Perl encourages users to download and install modules as needed. IT departments are not comfortable with upgrading Perl installations on thousands of server farm nodes. It would be an IT nightmare.

Python distributions, on the other hand, come with a majority of the module libraries included. Also, Python allows the packaging of applications so users do not have to manually download and install all module and library dependencies needed to run an application.

Final words

Perl is great at some things. For example, it has fantastic regular expression capabilities (it can even combine multiple regexp’s and match all of them together!). Perl is a worthy successor to awk.

Bottom line:  For use and throw scripts, Perl is great. But, if your code needs to be checked into a version control system and will potentially be modified by other people, I would prefer Python over Perl.

Monday, 29 June 2015

Difference between simulation and emulation

Car_racing_simulator_-_SBR_Racing,_Construma,_2015.04.17A simulation is a system that behaves similar to something else, but is implemented in an entirely different way. It provides the basic behaviour of a system but may not necessarily abide by all of the rules of the system being simulated. It is there to give you an idea about how something works.

Think of a flight simulator as an example. It looks and feels like you are flying an airplane, but you are completely disconnected from the reality of flying the plane, and you can bend or break those rules as you see fit. E.g.; Fly an Airbus A380 upside down between London and Sydney without breaking it.

An emulation is a system that behaves exactly like something else, and abides by all of the rules of the system being emulated. It’s like duplicating every aspect of the original device’s behaviour. It is effectively a complete replication of another system, right down to being binary compatible with the emulated system's inputs and outputs, but operating in a different environment to the environment of the original emulated system. The rules are fixed, and cannot be changed or the system fails.

Today hardware emulation has become an very popular tool for verification because of following reasons:

In the past few years, the emulation user community has expanded exponentially by the addition of software developers to the traditional base of hardware designers and verification engineers. 

Also, uses of hardware emulation have multiplied because of its versatility as a resource for debugging both the hardware and software of complex system-on-chip (SoC) designs. Hardware emulation is the only verification tool that can be deployed in more than one mode. In fact, it can be used in four main modes, some of which can be combined for added versatility. Because of this resourcefulness, hardware emulation can be used to achieve several verification objectives.

Following are the deployment modes for hardware emulator. These are characterized by type of stimulus applied to DUT:

  • In Circuit Emulation (ICE) : This was considered to be the traditional method when hardware emulation was deployed. In this case, the DUT is mapped inside the emulator and connected in in-circuit emulation (ICE) mode to the target system in place of a chip or processor for debug prior to silicon availability.
  • Transaction Based Acceleration (TBX) : Transaction-based emulation moves verification up a level of abstraction from the register transfer level (RTL), improving performance and debug productivity. It’s gaining popularity over the ICE mode because the physical target system is replaced by a virtual target system using a hardware verification language (HVL) such as
    SystemVerilog, SystemC, or C++.
  • Simulation Testbench Acceleration : In this mode, an RTL testbench drives the DUT in the emulator via a programmable logic interface (PLI). In general, this is the slowest performance mode, but it has some advantages, such as the fact that it does not require changes to the testbench.
  • Embeded Software Acceleration : In this mode, the software code is executed on the DUT processor mapped inside the emulator. This is the fastest performance mode, making it the choice for processing billions of verification cycles necessary to boot an operating system.

It is possible to mix some of the above modes, such as processing embedded software together with a virtual testbench driving the DUT via verification IP or even in ICE mode.

Wednesday, 24 December 2014

OSVVM – Thinking beyond constrained random

osvvm_logo_thumb What is OSVVM?

OSVVM stands for "Open Source VHDL Verification Methodology". OSVVM is a set of VHDL packages, initially developed by Jim Lewis of Synthworks. OSVVM helps you adopt modern constrained random verification techniques using VHDL.

Constraint random verification approach :

In testbenches, we generally want one each of a large set of test cases (transactions and/or sequences). Uniform randomization does not generate one each. Instead it has a significant amount of repetition. In general, uniform randomization takes O(N*LogN) randomizations to generate N unique test cases. As a result, it repeats Log N test cases. Even for small numbers such 64 test cases, constrained random will generate more than 4X more test cases than needed - actual results will vary with the randomization seed. Constrained random comes with this fundamental problem. Randomization is intended to be uniform over time. However constraint random verification has a number of benefits:

  • If you simulate longer, you generate more test vectors.
  • You may find bugs due to unexpected combinations of inputs, or extreme input values. With directed testing, it is all too easy just to test what you expect to happen, rather than trying to test what you don't expect to happen.
  • Once you have developed an automated test, it can still be used for directed testing.

Still what we need is an approach that only requires O(N) randomizations to generate N unique test cases. Generally these approaches are referred to as being Intelligent Testbenches. Indeed there are some tools out there that handle this. However, when we use a tool based approach we end up with a vendor specific solution. This removes one of the major benefits of a programming language based approach - encounter a issue (pricing or functionality) with one vendor and you can easily switch to another.

What we really need is a methodology for Intelligent Testbenches that is based on a standard language and works on numerous vendor tools.

OSVVM :

VHDL's Open Source VHDL Verification Methodology (OSVVM). OSVVM's methodology leverages the functional coverage you must write when you are using any randomization based approach. Intelligent Coverage™, the main randomization methodology for OSVVM, randomly selects a hole in the coverage and passes this to the stimulus generation process. The stimulus generation process uses this information, perhaps refines it using any methodology (directed, algorithmic, constrained random or file based), and then generates one or more transactions to accomplish generate the item that needs covered.

OSVVM can be used in your current VHDL testbench, in part or in whole as needed.  It allows mixing of our signature “Intelligent Coverage” methodology with other verification methodologies, such as directed, algorithmic, file based, and constrained random. Don’t throw out your existing VHDL testbench or testbench models, re-use them.

There is no new language to learn. There are no specialized “OO” approaches – just plain old VHDL entities and architectures. As a result, it is accessible to RTL designers. In fact, it is our goal to make our testbenches readable to verification (testbench), design (RTL), system, and software engineers.

OSVVM works with any VHDL testbench and is particularly effective when coupled with a transaction based testbench. For us, VHDL and OSVVM are the step beyond constrained random and SystemVerilog. Maybe it is time we update VHDL's acronym to mean Verification and Hardware Design Language.

Intelligent Coverage™ Methodology :

Verification starts with a test plan that identifies all items in a design that need to be tested.  OSVVM, like other advanced methodologies, uses functional coverage to observe conditions on interfaces and within the design to validate that the items identified in the test plan have occurred.  As such, functional coverage helps determine when testing is done.

Unlike other methodologies, in OSVVM’s Intelligent Coverage methodology,  functional coverage is the prime directive – it is where we start our process.  Intelligent Coverage is done in the following steps.

  • Write a high fidelity functional coverage (FC) model
  • Randomly select a hole in the functional coverage 
  • Refine the initial randomization with sequential code 
  • Apply the refined sequence (one or more transactions) 
  • Observe Coverage

The key point of Intelligent Coverage is that we randomize using the functional coverage. Then, if necessary, we refine the randomization using sequential code and any sequence generation method, including constrained random, algorithmic, directed, or file reading methods.

OSVVM is a Low Cost Solution :

The packages are free. OSVVM works on regular VHDL simulators (such as Mentor’s ModelSim and Aldec’s Active-HDL) without additional licenses. The only special language support required is VHDL-2002 protected types and VHDL-2008 type integer_vector (for older simulators, we have a work around for this).

To learn more about OSVVM, see:


OSVVM is an open source VHDL library that is free to use (no license fees) and works with any simulator that supports VHDL-2008 (or VHDL-2002 with a little work).
What is currently in the OSVVM library is only the beginning. Over time, I will be releasing our generic scoreboard package, memory modeling package, and others.

Friday, 16 August 2013

Verilog and SV Event Scheduler

A simulation timeslot is divided into ordered regions to provide a predictable interaction between design constructs. Verilog event scheduler has four regions for each simulation time as Fig 1.

verilog_even_scheduler Fig 1: Active region is for executing process statements; Inactive region is for executing process statements postponed with a “#0″ procedural delay; NBA region is for updating non-blocking assignments; Monitor region is for executing $monitor and $strobe and for calling user routines registered gor execution during this read-only region.

SystemVerilog adds regions to provide a predictable interaction between assertions, design code and testbench code.

sv_event_schedularFig 2: Preponed region is fora smapling signal values before anything in the time slice changes their values; additional observed region is for assertion evaluation. Re-Active and Re-Inactive regions is for executing assertion action blocks and testbenchh programs; Postponed region is for system tasks that record signal values at the end of the time slice.

SV introduces new verification blocks:

— Program
To have clear sepration between testbench and design, SV introdueces program block, which contains full environment for testbench. It is intended to reduce user-induced races. It executes in the Re-Active region.

— Final
“Final” block is used to print summary information in log file at the end of simulation. It executes at the end of the simulation (after explicit or implicit call to $finish) without delays.
e.g.

program asic_with_ankit;
  int error, warning;
  initial begin
  //Main program activities…..
  end
  final begin
  $display (“Test is done with %d errors and %d warnings”, error, warning);
  end
endprogram

— clocking blocks
A clocking block identifies clock signals and captures the timing and synchronization requirements of the blocks being modeled. It supports following features
– Input sampling
– Synchronous events
– Synchronous drives
e.g.

clocking cb @(posedge clk);
  default input #1step //default timing skew for inputs/outputs
          output #3;
  input dout;
  output reset, data;
  output negedge enable;
endclocking


clocking_skew Fig 3 clocking skew example


Inputs are sampled at clock edge and outputs are driven at clock edge. Input skew designates sample time before clock edge and output skew designates driving time after the clocking event.

Get free daily email updates!

Follow us!

Wednesday, 17 July 2013

Guidelines for Successful SoC Verification in OVM/UVM

uvm-logo-web1 With the increasing adoption of OVM/UVM, there is a growing demand for guidelines and best practices to ensure successful SoC verification. It is true that the verification problems did not change but the way the problems are approached and the structuring of the solutions, i.e. verification environments, depends much on the methodology. There are two key categories for SoC verification guidelines: process, enabled by tools, and methodology. The process guidelines are about what you need to do and in what order, while the methodology guidelines are about how to do it. This paper will first describe the basic tenets of OVM/UVM, and then it tries to summarize key guidelines to maximize the benefits of using state of the art verification methodology such as OVM/UVM.

The BASIC TENETS of OVM/UVM

1. Functionality encapsulation

OVM [1] promotes composition and reuse by encapsulating functionality in a basic block called ovm_component. This basic block contains a run task, i.e a functional block that can consume time that acts as an execution thread responsible for implementing functionality as simulation progress.

2. Transaction-Level Modeling (TLM)

OVM/UVM uses TLM standard to describe communication between verification components in an OVM/UVM environment. Because OVM/UVM standardizes the way components are connected, components are interchangeable as long as they provide and require the same interfaces. One of the main advantages of using TLM is in abstracting the pin and timing details. A transaction, the unit of information exchange between TLM components, encapsulates the abstract view of stimulus that can be expanded by a lower-level component. One the pitfalls that can undermine the value of TLM is adding excessive timing details by generating transaction and delivering them on each clock cycle.

3. Using sequences for stimulus generation

The transactions need to be generated by an entity in the verification environment. Relying on a component to generate the transactions is limiting because it will require changing the component each time a different sequence of transactions is required. Instead OVM/UVM allows for flexibility by introducing ovm_sequence. ovm_sequence is a wrapper object around a function called body(). It is very close to an OOP pattern called "functor" that wraps a function in an object to allow it to be passed as a parameter but SystemVerilog does not support operator overloading [1]. ovm_sequence when started, register itself with an ovm_sequencer which is an ovm_component that acts as the holder of different sequences and can connect to other ovm_components. The ovm_sequence and ovm_sequencer duo provides the flexibility of running different streams of transactions without having to change the component instantiation.

4. Configurability

Configurability, an enabler to productivity and reuse, is a key element in OVM/UVM. In OVM/UVM, user can change the behavior of an already instantiated component by three means: configuration API, Factory overrides and callbacks.

5. Layering

Layering is a powerful concept in which every level takes care of the details at specific layers. OVM layering can be applied to components, which can be called hierarchy and composition, and to configuration and to stimulus. Typically there is a correspondence between layering of components and objects. Layering stimulus, on the other hand, can reduce the complexity of stimulus generation.

6. Emphasis on reuse (vertical and horizontal)

All the tenets mentioned above lead to another important goal which is reuse. Extensibility, configurability and layering facilitate reuse. Horizontal reuse refers to reusing Verification IPs (VIPs) across projects and vertical reuse describes the ability to use block-level VIPs in cluster and chip level verification environments.

PROCESS GUIDELINES

1. Ordering of development tasks

The natural process for developing OVM/UVM verification environment is bottom-up. Blocks are first verified in block-level environments, and then the integration of the blocks into SoC is verified in chip-level testbench. Some refers to this methodology as IP-centric methodology because the blocks are considered IPs [4]. The focus of block-level verification is to verify the blocks thoroughly, while the chip-level is focused on verifying the integration of the blocks and the application scenarios. A bottom-up verification approach has several benefits:

  • Localization of bugs: finding bugs easily
  • Easier to test all the block modes at the block-level
  • Confidence in the block-level allowing them to be reused in several projects.

In this section we describe the recommended ordering for development of verification environment elements. Such ordering must be in mind when developing executable verification plans.

Table 1: Components Development Order

Interfaces
Agents
     Transaction
     Configuration
     Agent Skeleton
     Transactors
     Basic Sequences
Block level Subsystem
     Configuration
     Virtual Sequencer
      Initial Sequences/Tests
      Scoreboards & Protocol Checkers
      Coverage Model
      Constrained Random Sequences/Tests
Chip Level
       Integration of Subsystem environments
       Chip-Level Sequences/Tests

It is worth noting the following:

  • Once transaction fields are defined and implemented, the agent skeleton can be automatically generated.
  • Transactors refer to drivers and monitors
  • The reason for having the scoreboards & protocol checkers early on is to make sure that what was developed is functioning
  • Coverage model needs to be before the constrained random tests to guide the test development and eliminate redundancy. This is a corner stone of Coverage Driven verification. The coverage model not only guides the test writing effort but rather gives is a metric for verification progress and closure.
  • Each block/subsystem/cluster verification environment and tests act as a VIP for this block.

2. Use code and template generators

Whether you are relying on script or elaborate OVM template generators, these generators are keys to increase the productivity of verification engineers, reduce errors and increase code conformity. Code generators are also used to generate register models from specification thus automating the creation of these models

3. Qualify your VIPs

Qualify your VIP during development and before releasing them. First, several tools can conduct static checking on your VIP components for common errors and conformance to coding styles. They can also provide statistics about the size of your code, checks and covergroups.

Second, typically a simulator can provide statistics about memory consumption and performance bottlenecks of your VIP. Although SystemVerilog has automatic garbage collection, you can still have memory leaks because you keep a reference to dynamically allocated objects somewhere and forget about them.

Third, your VIPs should be robust to user mistakes whether in connections or proper use. You need to have sanity checks that can flag early a user error.

Finally, peer review is still beneficial to point-out issues that are missed in the other steps.

4. Incremental integration

As described in the introduction, OVM/UVM facilitates composition and layering. Several components/agents can form an environment and two or more environments can form a higher level environment. Incremental integration is important to reduce debugging time.

5. Better regression management and result analysis

The usual scripts that compile and run testcases come short when running complex OVM/UVM SoC verification environment. Typical requirements on run management is to keep track of seeds, log files of different tests, execution time, flexibility of running different groups of tests and running on local machine or grid. Once a regression is run we end up with data that needs to be processed to come out for useful information such as which tests passed/failed, common failure messages, which tests were more efficient and which seeds produced better coverage.

6. Communication and change management

Communication between verification engineers and specification owners should be captured in an issue tracking tool to avoid losing the information along the project. Also verification engineers need mechanism to share what they learn between each other, Wikis serve as good vehicles to knowledge sharing.

Change management is the other crucial element. By change management we are not only referring to code version management but the way the changes in RTL and block-level environments are handled in cluster or chip level environments.

METHODOLOGY GUIDELINES

1. CPU modeling

SoCs typically have one or more software programmable component such as microcontroller, microprocessor or DSP. Processor Driven Verification refers to using either a functional model of the processor or RTL model to verify the functionality of the SoCs. This approach is useful to verify the firmware interactions and certain application scenarios. However, for thorough verification of subsystems/cluster this approach can be costly in terms of effort, complexity, and simulation time. This paper proposes two level approach: for the verification of subsystems use a pin-accurate and protocol accurate Bus Functional Model (BFM), this will enable rapid development of the verification environment and tests and at the same time gives flexibility to the verification engineer in creating the environment and test. The BFM usually comes as VIP for the specific bus standard that the processor connects to. While the VIP usually models the standard interface faithfully, the processor might have extra side-band signals and interrupt. There are two approaches to this: the VIP can model in a generic way the side-band and interrupt controller behavior through the use of configuration, transactions and sequences. The other approach is to model the functionalities in different agents for side-band signals and interrupts. This increases the burden on the development and requires synchronization between different agents.

For the verification of firmware interaction, such as boot-loading or critical application scenarios, the RTL model or a full functional model can be used guarantee that firmware is validated versus the hardware it is going to run on and that the hardware.

2. Environment Reuse

Environments should be self-contained having only knowledge about its components and global elements and can communicate only through configuration mechanism, TLM connections or global events such as reset event. Following these rules, an environment at the block-level can be reused at the chip-level making the chip-level environment the integration of block-level environments.

3. Sequence Reuse

It is important to write sequences with eye on reusing them. In OVM/UVM, there are two types of sequences: sequence which sends transactions and sequences that starts sequences on sequencers. The latter is called a virtual sequence. Below is further classification of the sequences based on the functionality:

  • Basic agent sequence: this sequence allows the user to control the fields of a transaction that sent by the basic sequence from outside. The basic agent sequence acts as an interface or API to randomize or set the fields of the transactions sent by a higher layer which is usually the virtual sequence.
  • Register read/write sequences: these are sequences that try to write and read address mapped registers in the DUT. Two important rules need to be considered: they should have API that is independent of the bus protocol and rely on use the name of the register rather than address. A register package can be used to lookup the register address by name. For Example: OVM register package built-in sequences [5] supports this kind of abstraction. It is also expected that the UVM register package will support these rules. Abiding by these rules make these sequences reusable and maintainable because there is no need to update the sequence each time a register address changes.
  • DUT configuration sequences: some verification engineer try to provide sequences that abstracts the different configurations of the DUT into enum fields to ease the burden on the test writer. This way the test writer does not need to know about which register to write and with what value. These sequences are still reusable at the chip-level.
  • Virtual sequences on accessible interfaces at chip-level: These sequences are reusable from block-level to chip-level; some of them can be used to verify the integration into full-chip.
  • Virtual sequences on internal interfaces that are not visible at the chip-level: Special attention should be paid for sequences generating stimulus on interfaces that are no longer visible at the chip-level.

Although goals are different between block and chip level testing, some virtual sequences from block-level can be reused at chip-level as integration tests. Interfaces that become internal at the chip-level can be usually stimulated through some external interface. In order to make the last type of virtual sequences reusable at chip-level, it is better to plan ahead to abstract the data from the protocol. For example in Figure 1 of SoC diagram peripherals 1 through N are on peripheral bus which might be using a different protocol than the system bus. There are two approaches to make the sequences reusable:

Use functional abstraction by defining functions in the virtual sequence that can be overridden like:

write(register_name, value);

read(register_name, value);

Or rely on a layering technique like ovm_layering[3]. In this approach, a layering agent sits on top of a lower level agent and it forwards high-level transactions that can be translated by the low-level agent according to the bus standard. The high-level agent can be connected to a different low-level agent without any change to the high-level sequences.

Figure 1: Typical SoC Block Diagram20110509_1

4. Scoreboards

A critical component of self-checking testbenches is the scoreboard that is responsible for checking data integrity from input to output. A scoreboard is a TLM component, care should be taken not activate on a cycle by cycle basis but rather at the transaction level. In OVM/UVM, the scoreboard is usually connected to at least 2 analysis ports one from the monitors on the input(s) side and the other on the output(s) Figure 2 depicts these connections. A Scoreboard operation can be summarized in the following equations:

Expected = TF(Input Transaction);
Compare(Actual , Expected);

TF : Transfer function representing the DUT functionality from inputs to outputs

Sometimes the operation is described as predictor-comparator. Where the predictor computes the next output (transfer function) and the comparator checks the actual versus predicted (compare function). Usually the transfer function is not static but can change depending on the configuration of the devices. In SoC, most peripherals have memory-mapped registers that are used for configuration and status. These devices are usually called memory-mapped peripherals and they pose two challenges:

  • DUT transfer function and data-flow might change based on the configuration
  • Status bits should be verified

The common solution to the first one is to have a handle of the memory-map model and connect an analysis port from the configuration bus monitor to the scoreboard. On reception of new transaction on this analysis port, the scoreboard updates the peripheral's registerfile model and then uses it to update the transfer function accordingly. This approach has one disadvantage; each peripheral scoreboard has to implement the same functionality and needs to connect to the configuration bus monitor. A better approach is that the registerfile updates occur in a central component on the bus. To eliminate the need for the connections to the bus monitor, the register package can have an analysis port on each registerfile model. Each Scoreboard can connect to this registerfile model internally without the need for external connections. One of the requirements on the UVM register package is to have update notification method [6].

The second challenge is status bit verification. Status bits are usually modeled in the register model and register model can act as a predictor of the value of status bits. This requires that the scoreboard predicts changes to status bits, update the register models and on register reads the value read from the DUT is compared versus the register model.

There are other aspects to consider when implementing the scoreboards:

  • Data flow analysis: data flow can change based on configuration, or data flow can come from several inputs towards the output.
  • Scoreboard connection technique: Scoreboards can be connected to monitors using one of two ways: through ovm_imps in the scoreboard or through ovm_exports and tlm_analysis_fifos: the latter requires a thread on each tlm_analysis_fifo to get transactions while the former executes in the context of the caller.
  • Threaded or thread-less: the scoreboard can have 0 or more threads depending on a number of factors such as the connection method, the complexity of synchronization and experience of the developer. As a general rule, verification engineers should avoid spawning unnecessary threads in the scoreboard.

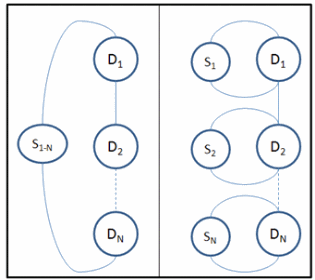
At the SoC level, there are two approaches to organize scoreboards with End-to-End and Multi-step [2]. Figure 3 depicts the difference between the two. The multi-step approach has several advantages over the end-to-end:

  • By product of the block-level to chip-level reuse.
  • The checking task is simpler since it is divided over several components each concerned with specific block.
  • Easy to localize bugs at block-level since the violating block scoreboard will flag the error

Figure 2: Scoreboard Connection in OVM20110509_2
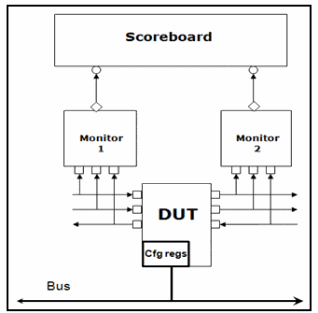
 Figure 2: Scoreboard Connection in OVM20110509_3

CONCLUSION

OVM/UVM is a powerful verification methodology. To maximize the value achieved by adopting OVM/UVM there is a need for guidelines. These guidelines are not only for the methodology deployment but also for the verification process. This paper tried to summarize some of the pitfalls and tradeoffs and provide guidelines for successful SoC verification. The set of guidelines in this paper can help you plan ahead your SoC verification environment, avoid pitfalls and increase productivity.

Get free daily email updates!

Follow us!

Thursday, 27 June 2013

SystemVerilog Fork Disable "Gotchas"

SystemVerilig-fork-join This is a long post with a lot of SystemVerilog code. The purpose of this entry is to hopefully save you from beating your head against the wall trying to figure out some of the subtleties of SystemVerilog processes (basically, threads). Subtleties like these are commonly referred to in the industry as "Gotchas" which makes them sound so playful and fun, but they really aren't either.

I encourage you to run these examples with your simulator (if you have access to one) so that a) you can see the results first hand and better internalize what's going on, and b) you can tell me in the comments if this code works fine for you and I'll know I should go complain to my simulator vendor.

OK, I'll start with a warm-up that everyone who writes any Verilog or SystemVerilog at all should be aware of, tasks are static by default. If you do this:

module top;
task do_stuff(int wait_time);
#wait_time $display("waited %0d, then did stuff", wait_time);
endtask

initial begin
fork
do_stuff(10);
do_stuff(5);
join
end
endmodule

both do_stuff calls will wait for 5 time units, and you see this:

waited 5, then did stuff

I suppose being static by default is a performance/memory-use optimization, but it's guaranteed to trip up programmers who started with different languages. The fix is to make the task "automatic" instead of static:

module top;
task automatic do_stuff(int wait_time);
#wait_time $display("waited %0d, then did stuff", wait_time);
endtask

initial begin
fork
do_stuff(10);
do_stuff(5);
join
end
endmodule

And now you get what you expected:

module top;
task automatic do_stuff(int wait_time);
#wait_time $display("waited %0d, then did stuff", wait_time);
endtask

initial begin
fork
do_stuff(10);
do_stuff(5);
join_any
$display("fork has been joined");
end
endmodule

You'll get this output:

waited 5, then did stuff
fork has been joined
waited 10, then did stuff

That's fine, but that extra action from the slower do_stuff after the fork-join_any block has finished might not be what you wanted. You can name the fork block and disable it to take care of that, like so:

module top;
task automatic do_stuff(int wait_time);
#wait_time $display("waited %0d, then did stuff", wait_time);
endtask

initial begin
fork : do_stuff_fork
do_stuff(10);
do_stuff(5);
join_any
$display("fork has been joined");
disable do_stuff_fork;
end
endmodule

Unless your simulator, like mine, "in the current release" will not disable sub-processes created by a fork-join_any statement. Bummer. It's OK, though, because SystemVerilog provides a disable fork statement that disables all active threads of a calling process (if that description doesn't already make you nervous, just wait). Simply do this:

module top;
task automatic do_stuff(int wait_time);
#wait_time $display("waited %0d, then did stuff", wait_time);
endtask

initial begin
fork : do_stuff_fork
do_stuff(10);
do_stuff(5);
join_any
$display("fork has been joined");
disable fork;
end
endmodule

And you get:

waited 5, then did stuff
fork has been joined

Nothing wrong there. Now let's say you have a class that is monitoring a bus. Using a classes are cool because if you have two buses you can create two instances of your monitor class, one for each bus. We can expand our code example to approximate this scenario, like so:

class a_bus_monitor;
int id;

function new(int id_in);
id = id_in;
endfunction

task automatic do_stuff(int wait_time);
#wait_time $display("monitor %0d waited %0d, then did stuff", id, wait_time);
endtask

task monitor();
fork : do_stuff_fork
do_stuff(10 + id);
do_stuff(5 + id);
join_any
$display("monitor %0d fork has been joined", id);
disable do_stuff_fork;
endtask
endclass

module top;
a_bus_monitor abm1;
a_bus_monitor abm2;
initial begin
abm1 = new(1);
abm2 = new(2);
fork
abm2.monitor();
abm1.monitor();
join
$display("main fork has been joined");
end
endmodule

Note that I went back to disabling the fork by name instead of using the disable fork statement. This is to illustrate another gotcha. That disable call will disable both instances of the fork, monitor 1's instance and monitor 2's. You get this output:

monitor 1 waited 6, then did stuff
monitor 1 fork has been joined
monitor 2 fork has been joined
main fork has been joined

Because disabling by name is such a blunt instrument, poor monitor 2 never got a chance. Now, if you turn the disable into a disable fork, like so:

class a_bus_monitor;
int id;

function new(int id_in);
id = id_in;
endfunction

task automatic do_stuff(int wait_time);
#wait_time $display("monitor %0d waited %0d, then did stuff", id, wait_time);
endtask

task monitor();
fork : do_stuff_fork
do_stuff(10 + id);
do_stuff(5 + id);
join_any
$display("monitor %0d fork has been joined", id);
disable fork;
endtask

endclass

module top;
a_bus_monitor abm1;
a_bus_monitor abm2;
initial begin
abm1 = new(1);
abm2 = new(2);
fork
abm2.monitor();
abm1.monitor();
join
$display("main fork has been joined");
end
endmodule

You get what you expect:

monitor 1 waited 6, then did stuff
monitor 1 fork has been joined
monitor 2 waited 7, then did stuff
monitor 2 fork has been joined
main fork has been joined

It turns out that, like when you disable something by name, disable fork is a pretty blunt tool also. Remember my ominous parenthetical "just wait" above? Here it comes. Try adding another fork like this (look for the fork_something task call):

class a_bus_monitor;
int id;

function new(int id_in);
id = id_in;
endfunction

function void fork_something();
fork
# 300 $display("monitor %0d: you'll never see this", id);
join_none
endfunction

task automatic do_stuff(int wait_time);
#wait_time $display("monitor %0d waited %0d, then did stuff", id, wait_time);
endtask

task monitor();
fork_something();
fork : do_stuff_fork
do_stuff(10 + id);
do_stuff(5 + id);
join_any
$display("monitor %0d fork has been joined", id);
disable fork;
endtask

endclass

module top;
a_bus_monitor abm1;
a_bus_monitor abm2;

initial begin
abm1 = new(1);
abm2 = new(2);
fork
abm2.monitor();
abm1.monitor();
join
$display("main fork has been joined");
end
endmodule

The output you get is:

monitor 1 waited 6, then did stuff
monitor 1 fork has been joined
monitor 2 waited 7, then did stuff
monitor 2 fork has been joined
main fork has been joined

Yup, fork_something's fork got disabled too. How do you disable only the processes inside the fork you want? You have to wrap your fork-join_any inside of a fork-join, of course. That makes sure that there aren't any other peers or child processes for disable fork to hit. Here's the zoomed in view of that (UPDATE: added missing begin...end for outer fork):

task monitor();
fork_something();
fork begin
fork : do_stuff_fork
do_stuff(10 + id);
do_stuff(5 + id);
join_any
$display("monitor %0d fork has been joined", id);
disable fork;
end
join
endtask

And now you get what you expect:

monitor 2 fork has been joined
monitor 1 fork has been joined
monitor 1 waited 6, then did stuff
monitor 2 waited 7, then did stuff
main fork has been joined
monitor 1 waited 11, then did stuff
monitor 2 waited 12, then did stuff
monitor 2: you'll never see this
monitor 1: you'll never see this

So, wrap your fork-join_any inside a fork-join or else it's, "Gotcha!!!" (I can almost picture the SystemVerilog language designers saying that out loud, with maniacal expressions on their faces).

But wait, I discovered something even weirder. Instead of making that wrapper fork, you can just move the fork_something() call after the disable fork call and then it doesn't get disabled (you actually see the "you'll never see this" message, try it). So, you might think, just reordering your fork and disable fork calls and that will fix your problem. It will, unless (I learned by sad experience) the monitor task is being repeatedly called inside a forever loop. Here's a simplification of the code that really inspired me to write this all up:

class a_bus_monitor;
int id;

function new(int id_in);
id = id_in;
endfunction

function void fork_something();
fork
# 30 $display("monitor %0d: you'll never see this", id);
join_none
endfunction

task automatic do_stuff(int wait_time);
#wait_time $display("monitor %0d waited %0d, then did stuff", id, wait_time);
endtask // do_stuff

task monitor_subtask();
fork : do_stuff_fork
do_stuff(10 + id);
do_stuff(5 + id);
join_any
$display("monitor %0d fork has been joined", id);
disable fork;
fork_something();
endtask

task monitor();
forever begin
monitor_subtask();
end
endtask

endclass

module top;
a_bus_monitor abm1;
a_bus_monitor abm2;

initial begin
abm1 = new(1);
abm2 = new(2);
fork
abm2.monitor();
abm1.monitor();
join_none
$display("main fork has been joined");
# 60 $finish;
end
endmodule

The fork inside the fork_something task will get disabled before it can do its job, even though it's after the disable fork statement.

My advice? Just always wrap any disable fork calls inside a fork-join.

Tuesday, 8 January 2013

Metric driven Verification methodology

As the design complexity increases, the use of traditional verification methodology becomes minimal for verifying hardware designs. Directed Tests were used quite long back. Later, Coverage Driven Verification methodology (CDV) came up. In directed tests approach, verification engineer is going to state exactly what stimulus should be applied to the Design Under Test (DUT). This can be applied only for small designs which has very limited features.

As the design became more complex, verification engineers started looking for the possibility of checking the effectiveness of the verification, or in other words the features covered during verification. This is the whole idea behind CDV, which is done by setting up cover-groups for the features to be verified and also for coverage closure. The stimulus generation is random (by using Constrained Random Generation method) for CDV, so this approach is much more effective than directed tests. CDV improves productivity and also quality, but you will find difficulties in planning and estimating the verification completion. For complex designs there will be thousands of cover-groups and it is difficult to map with the specification.

MDV_glimpse1

Metric Driven Verification (MDV) is a proven methodology for verifying hardware designs which has been introduced by Cadence. This is based on CDV approach, but overcomes pitfalls in CDV approach. In MDV flow, features are stated in an executable verification plan. This is the first phase for the verification and later this will be correlated with the actual cover-groups. This uses constrained random for stimulus generation which helps to have better coverage than traditional simulation method.

Different stages in Metric Driven Verification Flow:
The different stages in MDV flow are plan, construct, execute, measure and analyze. The coverage information from “measure” stage will be mapped to verification plan and do the analysis to see which features are already verified with existing tests and the given seeds. Having this information upfront helps to improve the verification environment and hence there will not be any chance of missing out the planned features.

The verification plan is a living document to achieve the goal of verifying the functionality of the design completely. This needs to correlate functional specification, designers’ intent and implementation of test-bench. The plan can be an XML file, a spreadsheet, a document or a text file and defines exactly what needs to be verified. Different sections can be made in verification plan like interested features, co-features, interface features etc. A good and meaningful verification plan always helps the verification engineers to achieve his final goal by correlating different coverage results to each feature. It also helps to measure the progress of verification at different stages and can re-evaluate estimated effort if required.

Without a plan it is always difficult to differentiate high priority and low priority features and all coverage information will appear flat. The verification engineers will not have a clear picture on the progress or verification closure.

MDV_Flow2

The next step is to construct a verification environment. The verification engineers start constructing an environment by reusing existing verification IPs, reusing available UVM/OVM libraries and/or developing from scratch some part of the environment. This depends on what you decide in the planning stage. The test-bench and some of the test cases will be ready by this time.

Once the verification environment is ready, test cases can be executed and results checked. The tool vManager from Cadence can fire the regression and can easily capture the result and correlate with verification plan, if you specify the v-plan feature information while defining the coverage in your code. Incisive Metric Centre is now the default way of viewing coverage as a unified coverage browser, which clearly shows up what part of the design has been exercised.

Once the coverage information is available, this should be analyzed with the v-plan. Cadence INCISIV tool package helps to get a clear picture on v-plan to feature mapping against the coverage result. It also shows coverage based ranking to see which test is most effective and which tests are redundant. The tests with ranking id of -1 is redundant and can be filtered out while ranking id of 0 would be the most effective test. We can find out the ranking of other tests as well and the effective improvement in the coverage by executing those tests.

By having better verification planning and management and correlating with coverage, MDV flow significantly improves the productivity of your verification.

Get free daily email updates!

Follow us!

Wednesday, 19 December 2012

SystemVerilog Fork Disable

This is a long post with a lot of SystemVerilog code. The purpose of this entry is to hopefully save you from beating your head against the wall trying to figure out some of the subtleties of SystemVerilog processes (basically, threads). Subtleties like these are commonly referred to in the industry as "Gotchas" which makes them sound so playful and fun, but they really aren't either.

I encourage you to run these examples with your simulator (if you have access to one) so that a) you can see the results first hand and better internalize what's going on, and b) you can tell me in the comments if this code works fine for you and I'll know I should go complain to my simulator vendor.

OK, I'll start with a warm-up that everyone who writes any Verilog or SystemVerilog at all should be aware of, tasks are static by default. If you do this:

module top;
task do_stuff(int wait_time);
#wait_time $display("waited %0d, then did stuff", wait_time);
endtask

initial begin
fork
do_stuff(10);
do_stuff(5);
join
end
endmodule

both do_stuff calls will wait for 5 time units, and you see this:


waited 5, then did stuff

I suppose being static by default is a performance/memory-use optimization, but it's guaranteed to trip up programmers who started with different languages. The fix is to make the task "automatic" instead of static:


module top;
task automatic do_stuff(int wait_time);
#wait_time $display("waited %0d, then did stuff", wait_time);
endtask

initial begin
fork
do_stuff(10);
do_stuff(5);
join
end
endmodule

And now you get what you expected:


waited 5, then did stuff
waited 10, then did stuff

That's fine, but that extra action from the slower do_stuff after the fork-join_any block has finished might not be what you wanted. You can name the fork block and disable it to take care of that, like so:


module top;
task automatic do_stuff(int wait_time);
#wait_time $display("waited %0d, then did stuff", wait_time);
endtask

initial begin
fork : do_stuff_fork
do_stuff(10);
do_stuff(5);
join_any
$display("fork has been joined");
disable do_stuff_fork;
end
endmodule

Unless your simulator, like mine, "in the current release" will not disable sub-processes created by a fork-join_any statement. Bummer. It's OK, though, because SystemVerilog provides a disable fork statement that disables all active threads of a calling process (if that description doesn't already make you nervous, just wait). Simply do this:


module top;
task automatic do_stuff(int wait_time);
#wait_time $display("waited %0d, then did stuff", wait_time);
endtask

initial begin
fork : do_stuff_fork
do_stuff(10);
do_stuff(5);
join_any
$display("fork has been joined");
disable fork;
end
endmodule

And you get:


waited 5, then did stuff
fork has been joined

Nothing wrong there. Now let's say you have a class that is monitoring a bus. Using a classes are cool because if you have two buses you can create two instances of your monitor class, one for each bus. We can expand our code example to approximate this scenario, like so:


class a_bus_monitor;
int id;

function new(int id_in);
id = id_in;
endfunction

task automatic do_stuff(int wait_time);
#wait_time $display("monitor %0d waited %0d, then did stuff", id, wait_time);
endtask

task monitor();
fork : do_stuff_fork
do_stuff(10 + id);
do_stuff(5 + id);
join_any
$display("monitor %0d fork has been joined", id);
disable do_stuff_fork;
endtask
endclass

module top;
a_bus_monitor abm1;
a_bus_monitor abm2;
initial begin
abm1 = new(1);
abm2 = new(2);
fork
abm2.monitor();
abm1.monitor();
join
$display("main fork has been joined");
end
endmodule

Note that I went back to disabling the fork by name instead of using the disable fork statement. This is to illustrate another gotcha. That disable call will disable both instances of the fork, monitor 1's instance and monitor 2's. You get this output:


monitor 1 waited 6, then did stuff
monitor 1 fork has been joined
monitor 2 fork has been joined
main fork has been joined

Because disabling by name is such a blunt instrument, poor monitor 2 never got a chance. Now, if you turn the disable into a disable fork, like so:


class a_bus_monitor;
int id;

function new(int id_in);
id = id_in;
endfunction

task automatic do_stuff(int wait_time);
#wait_time $display("monitor %0d waited %0d, then did stuff", id, wait_time);
endtask

task monitor();
fork : do_stuff_fork
do_stuff(10 + id);
do_stuff(5 + id);
join_any
$display("monitor %0d fork has been joined", id);
disable fork;
endtask

endclass

module top;
a_bus_monitor abm1;
a_bus_monitor abm2;
initial begin
abm1 = new(1);
abm2 = new(2);
fork
abm2.monitor();
abm1.monitor();
join
$display("main fork has been joined");
end
endmodule

You get what you expect:


monitor 1 waited 6, then did stuff
monitor 1 fork has been joined
monitor 2 waited 7, then did stuff
monitor 2 fork has been joined
main fork has been joined

It turns out that, like when you disable something by name, disable fork is a pretty blunt tool also. Remember my ominous parenthetical "just wait" above? Here it comes. Try adding another fork like this (look for the fork_something task call):


class a_bus_monitor;
int id;

function new(int id_in);
id = id_in;
endfunction

function void fork_something();
fork
# 300 $display("monitor %0d: you'll never see this", id);
join_none
endfunction

task automatic do_stuff(int wait_time);
#wait_time $display("monitor %0d waited %0d, then did stuff", id, wait_time);
endtask

task monitor();
fork_something();
fork : do_stuff_fork
do_stuff(10 + id);
do_stuff(5 + id);
join_any
$display("monitor %0d fork has been joined", id);
disable fork;
endtask

endclass

module top;
a_bus_monitor abm1;
a_bus_monitor abm2;

initial begin
abm1 = new(1);
abm2 = new(2);
fork
abm2.monitor();
abm1.monitor();
join
$display("main fork has been joined");
end
endmodule

The output you get is:


monitor 1 waited 6, then did stuff
monitor 1 fork has been joined
monitor 2 waited 7, then did stuff
monitor 2 fork has been joined
main fork has been joined

Yup, fork_something's fork got disabled too. How do you disable only the processes inside the fork you want? You have to wrap your fork-join_any inside of a fork-join, of course. That makes sure that there aren't any other peers or child processes for disable fork to hit. Here's the zoomed in view of that (UPDATE: added missing begin...end for outer fork):


task monitor();
fork_something();
fork begin
fork : do_stuff_fork
do_stuff(10 + id);
do_stuff(5 + id);
join_any
$display("monitor %0d fork has been joined", id);
disable fork;
end
join
endtask

And now you get what you expect:


monitor 2 fork has been joined
monitor 1 fork has been joined
monitor 1 waited 6, then did stuff
monitor 2 waited 7, then did stuff
main fork has been joined
monitor 1 waited 11, then did stuff
monitor 2 waited 12, then did stuff
monitor 2: you'll never see this
monitor 1: you'll never see this

So, wrap your fork-join_any inside a fork-join or else it's, "Gotcha!!!" (I can almost picture the SystemVerilog language designers saying that out loud, with maniacal expressions on their faces).

But wait, I discovered something even weirder. Instead of making that wrapper fork, you can just move the fork_something() call after the disable fork call and then it doesn't get disabled (you actually see the "you'll never see this" message, try it). So, you might think, just reordering your fork and disable fork calls and that will fix your problem. It will, unless (I learned by sad experience) the monitor task is being repeatedly called inside a forever loop. Here's a simplification of the code that really inspired me to write this all up:

class a_bus_monitor;
int id;

function new(int id_in);
id = id_in;
endfunction

function void fork_something();
fork
# 30 $display("monitor %0d: you'll never see this", id);
join_none
endfunction

task automatic do_stuff(int wait_time);
#wait_time $display("monitor %0d waited %0d, then did stuff", id, wait_time);
endtask // do_stuff

task monitor_subtask();
fork : do_stuff_fork
do_stuff(10 + id);
do_stuff(5 + id);
join_any
$display("monitor %0d fork has been joined", id);
disable fork;
fork_something();
endtask

task monitor();
forever begin
monitor_subtask();
end
endtask

endclass

module top;
a_bus_monitor abm1;
a_bus_monitor abm2;

initial begin
abm1 = new(1);
abm2 = new(2);
fork
abm2.monitor();
abm1.monitor();
join_none
$display("main fork has been joined");
# 60 $finish;
end
endmodule

The fork inside the fork_something task will get disabled before it can do its job, even though it's after the disable fork statement. Gotcha!!!


My advice is to always wrap any disable fork calls inside a fork-join.


Get free daily email updates!


Follow us!